
Grafana
Compose observability at scale
Grafana is an open-source platform designed for monitoring, visualization, and operational analytics. It supports multiple data sources including Prometheus and Loki, allowing users to create comprehensive dashboards that provide insights into their applications and infrastructure. Ideal for IT and DevOps teams, Grafana enables real-time monitoring and performance analytics, facilitating proactive incident management and system optimization.
Related Apps
Grafana
Compose observability at scale

Trakkr
Monitor LLMs in Real-Time

Netdata
Real-Time Monitoring For Infrastructure
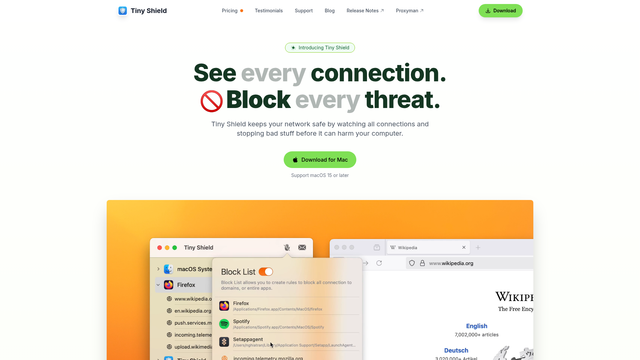
Tiny Shield
Block every threat on macOS
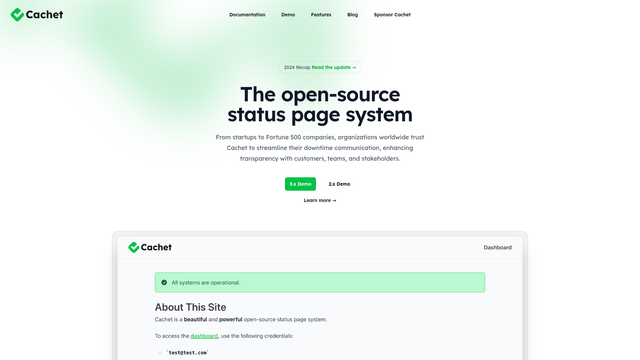
Cachet
Streamline downtime communication
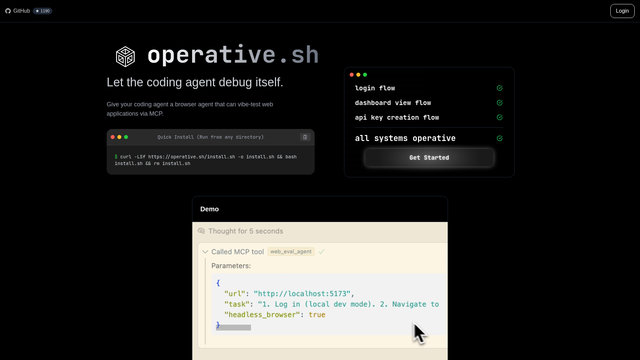
Operative
Debug with browser agents
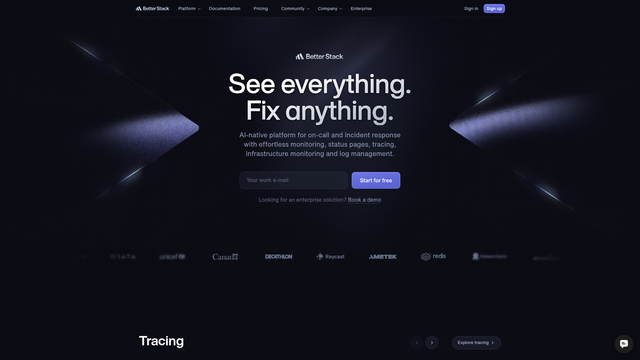
Better Stack
Observability Meets Incident Management
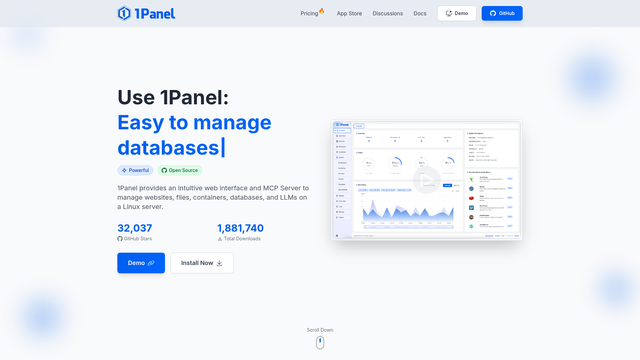
1Panel
Manage Linux servers easily
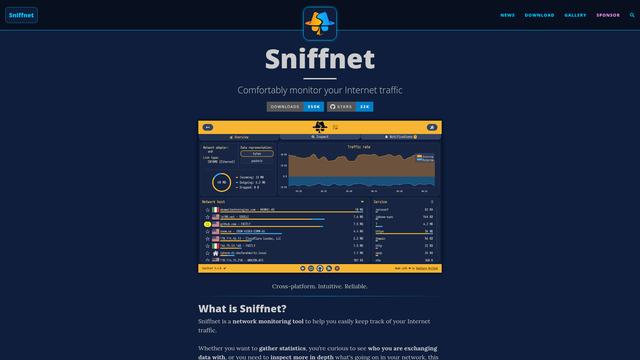
Sniffnet
Monitor your Internet traffic easily
Uptime Kuma
Self-hosted monitoring solution
Grafana
Compose observability at scale
Grafana is an open-source platform designed for monitoring, visualization, and operational analytics. It supports multiple data sources including Prometheus and Loki, allowing users to create comprehensive dashboards that provide insights into their applications and infrastructure. Ideal for IT and DevOps teams, Grafana enables real-time monitoring and performance analytics, facilitating proactive incident management and system optimization.
