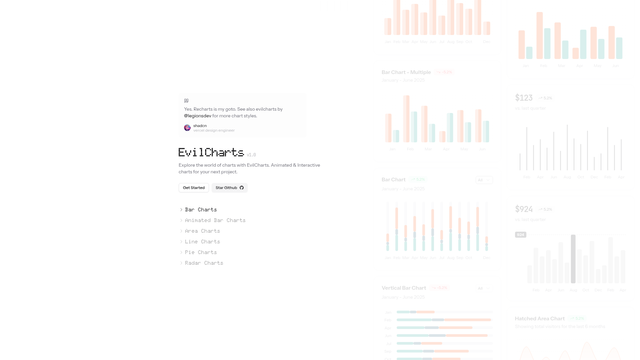
Evil Charts
Animated charts for your projects
Evil Charts offers a range of beautiful and animated charts designed to enhance data visualization in software projects. Ideal for developers and designers, this tool allows users to integrate interactive charts into their applications, improving user engagement and data interpretation. Example use case: A web developer incorporates Evil Charts in a dashboard for real-time data analytics, providing clients with dynamic and informative visualizations.
Related Apps
Evil Charts
Animated charts for your projects

Boardmix
AI Online Whiteboard for Collaboration

Tinkercad
Free 3D design and coding web app
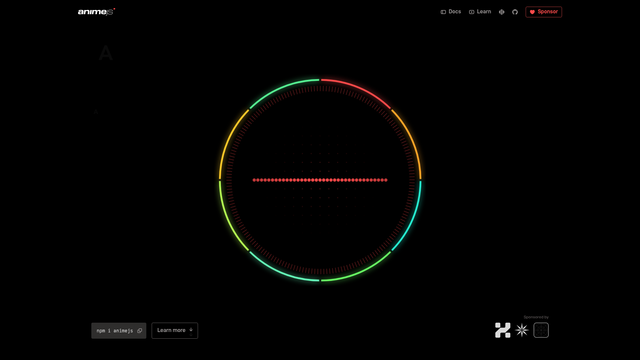
Anime.js
Animate anything with JavaScript
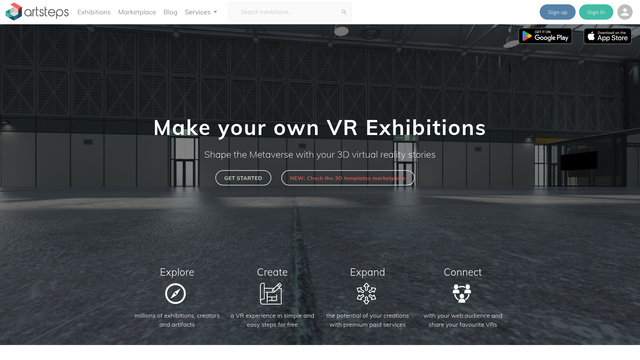
Artsteps
Make your own VR Exhibitions

Backlight
Build Design Systems Efficiently

Blender
Free and Open 3D Creation Software

Canva
Visual Suite for Everyone

VistaCreate
Free Graphic Design Software

Onlook
Cursor for Designers
Evil Charts
Animated charts for your projects
Evil Charts offers a range of beautiful and animated charts designed to enhance data visualization in software projects. Ideal for developers and designers, this tool allows users to integrate interactive charts into their applications, improving user engagement and data interpretation. Example use case: A web developer incorporates Evil Charts in a dashboard for real-time data analytics, providing clients with dynamic and informative visualizations.
