Related Apps

Chartbrew
Client reports for your team and clients

Work With Data
Making data accessible to all
Lume
Illuminate Your Data Insights
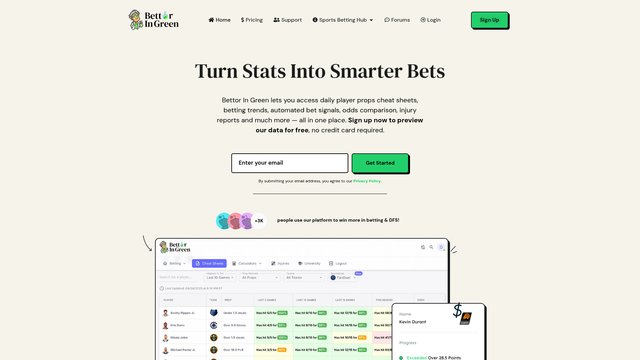
Bettor In Green
Turn Stats Into Smarter Bets

Talk to Data
Instant Answers & Visualizations

Equals
GTM analytics for revenue growth

Wren AI
Smarter Decisions with GenBI

Hashboard
BI that will make you love data

Omni Analytics
Explore data with speed and accuracy

Julius AI
Expert-level insights in seconds
Chartbrew
Client reports for your team and clients
Chartbrew offers an intuitive platform for creating and sharing interactive reports and dashboards from various data sources. It is designed for teams and clients in need of dynamic, real-time data visualization and reporting. An example use case is a marketing team using Chartbrew to track campaign performance across multiple channels, enabling quick decision-making and report sharing with stakeholders.
